Can we do this in R?
Answering questions about air quality, one question at a time
Meenakshi Kushwaha
ILK Labs
6th July, 2021
Who we are?

What this means is that we are also in different places in our R journey - from beginner to advanced.
What we do?
We measure air quality to answer questions like
- Is one block dirtier than other?
- Is one season different than other?
- Do low cost instruments answer questions reliably?
- Can we adapt cutting edge methods from different contexts for India?
Also...
- National level surveys
- Model building with satellite and ground data
2 types of Air Quality Measurements
Staionary monitoring
2 types of Air Quality Measurements
Staionary monitoring

Mobile monitoring
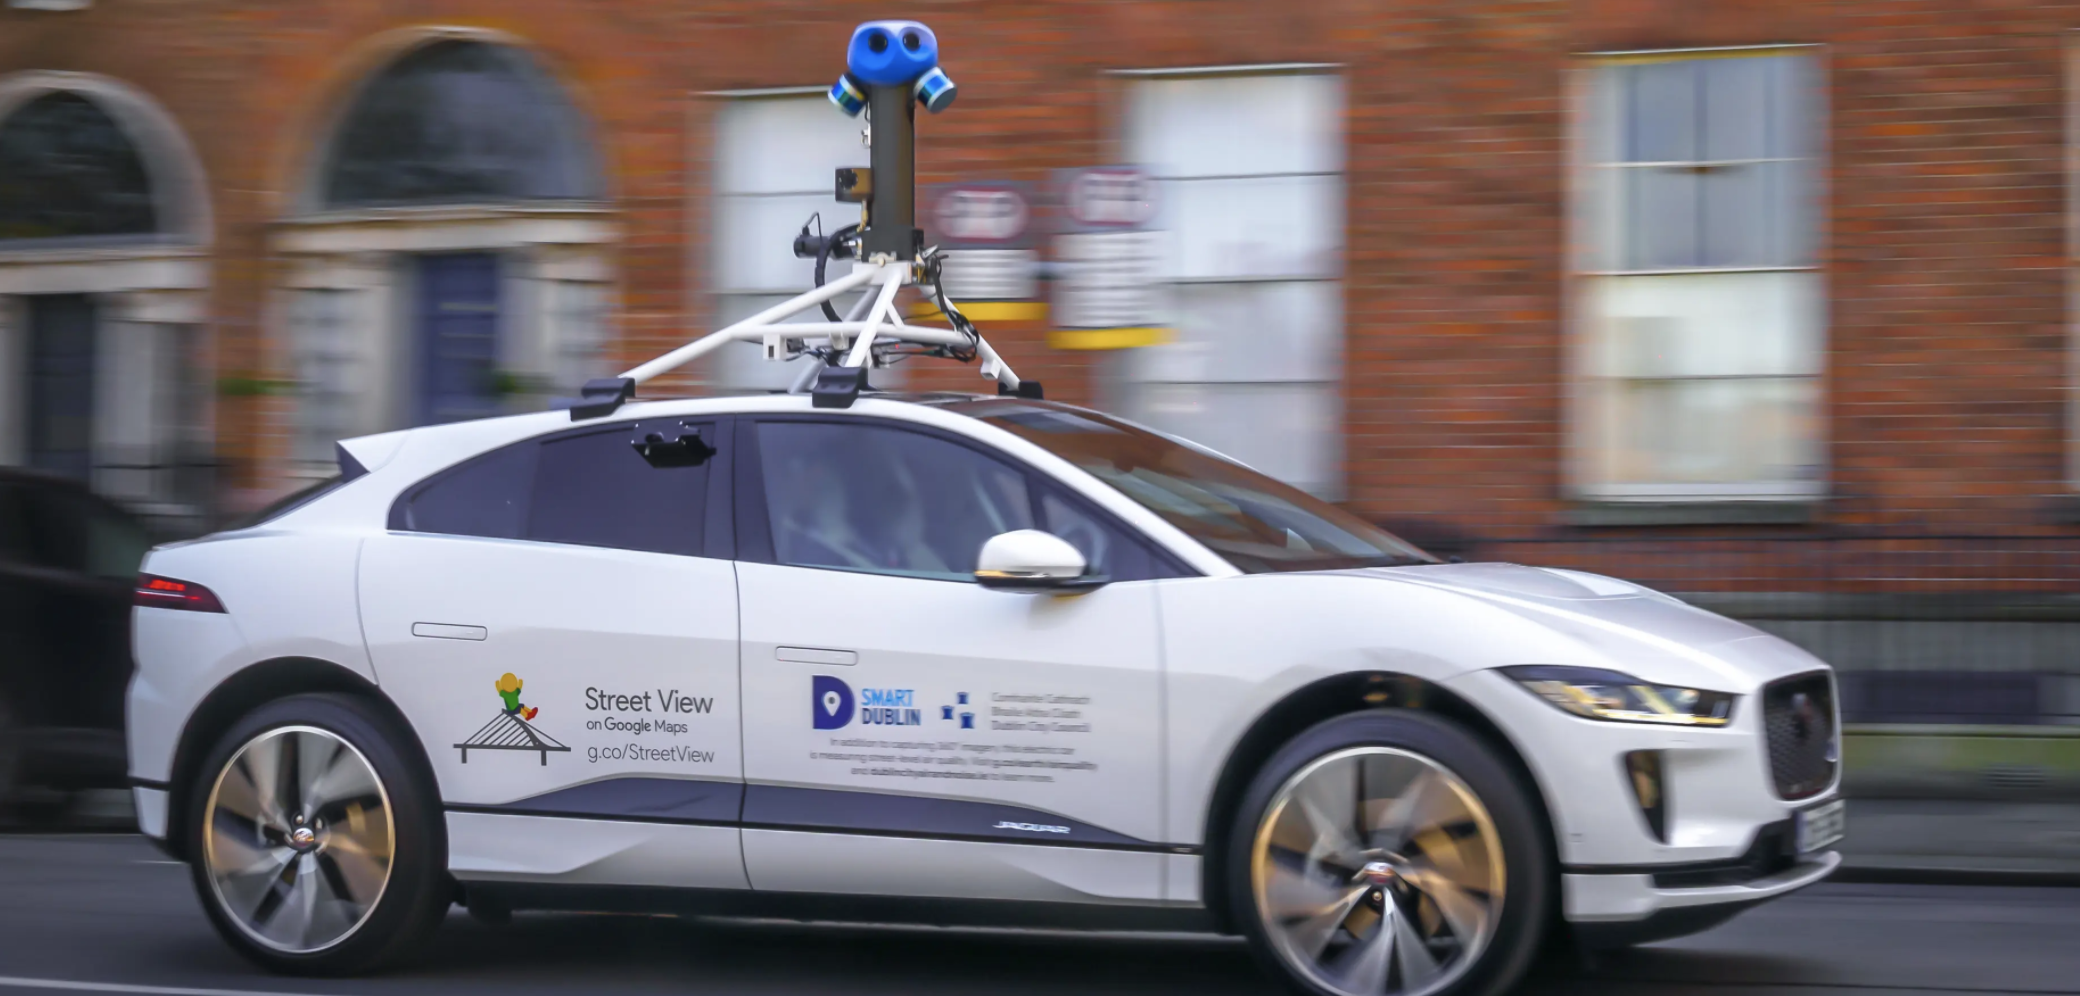
Typically, we have two main types of air quality measurements.
Stationary Monitoring
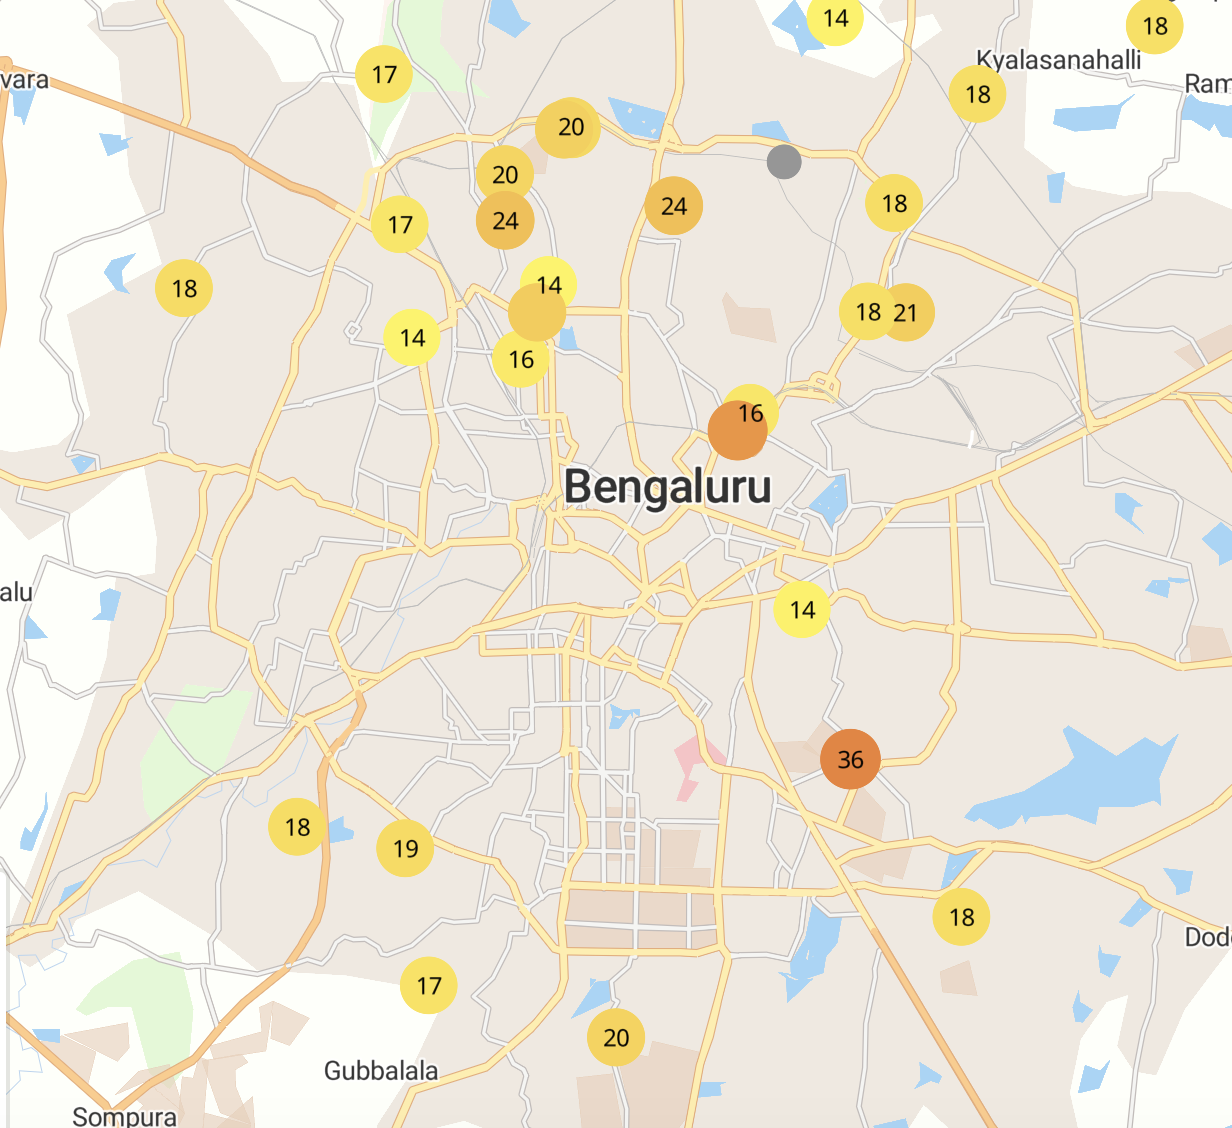
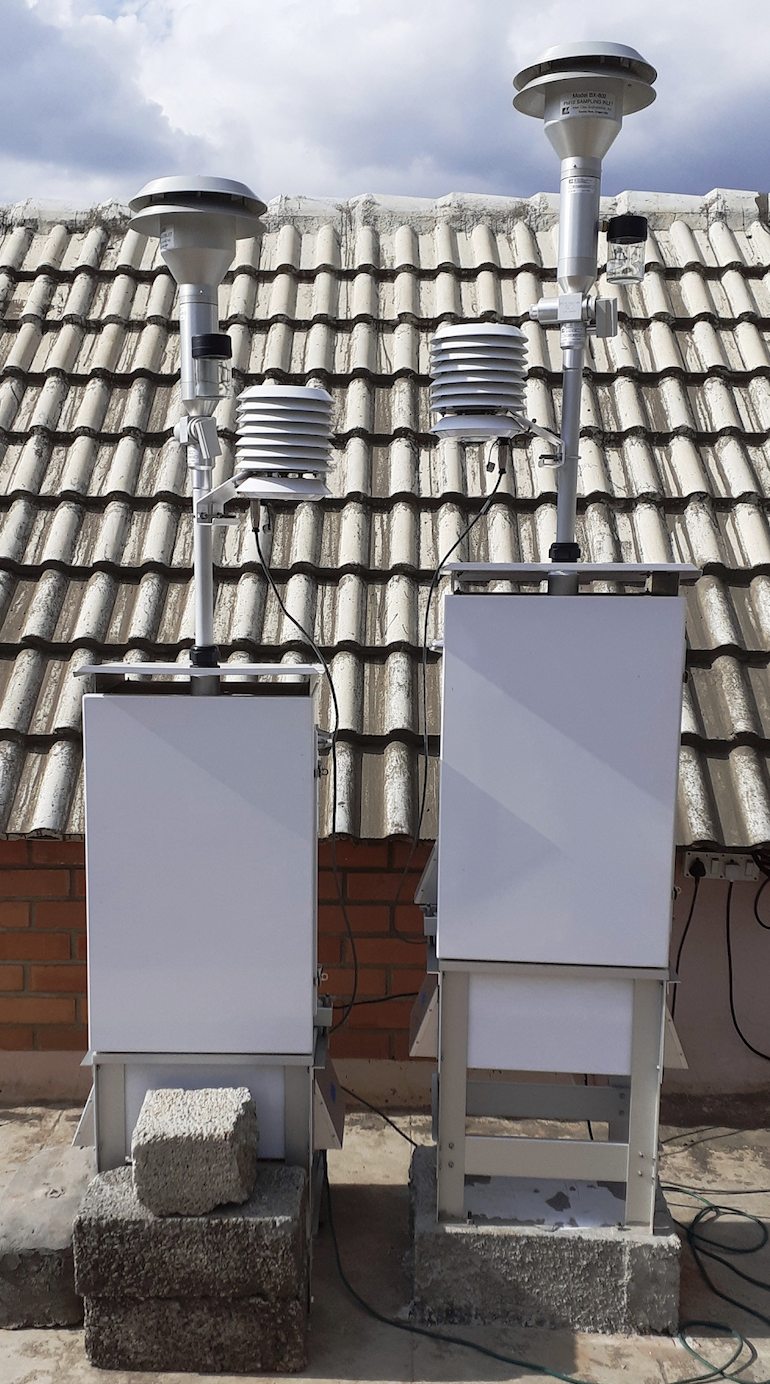
This is what stationary monitoring network looks like. Multiple sensors recording data at real time ~ 1 min frequency. Gives information about trends at the city scale
Mobile Monitoring

For a neighborhood level measurement, we use mobile monitoring. This schematic shows the many instruments that go in the mobile platform. You can imagine the complexity, diff instruments, have different download methods, from the point of view of analysis - different data formats, different time stamps, etc.
This is what it looks like in practise
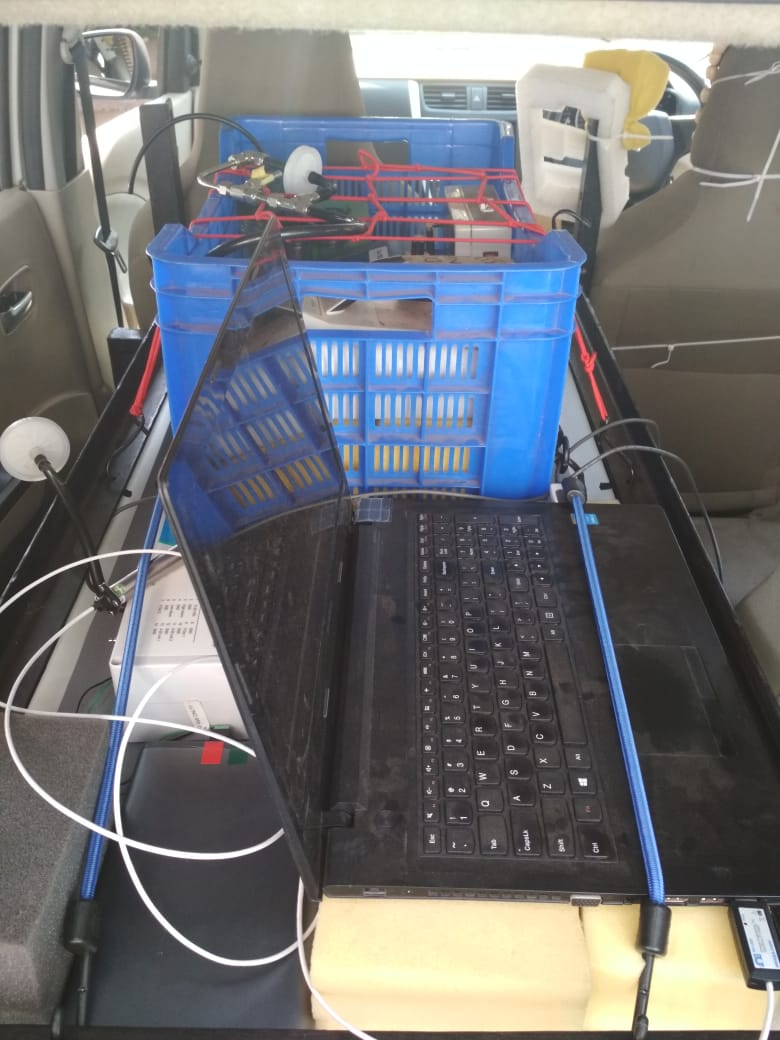
We are looking at the inside of the car now. We have a laptop as a logger for some instruments. And all insruments are secured in the blue tray with inlets outside the vehicle. This is what looks like in pracise,...
and, sometimes like this...
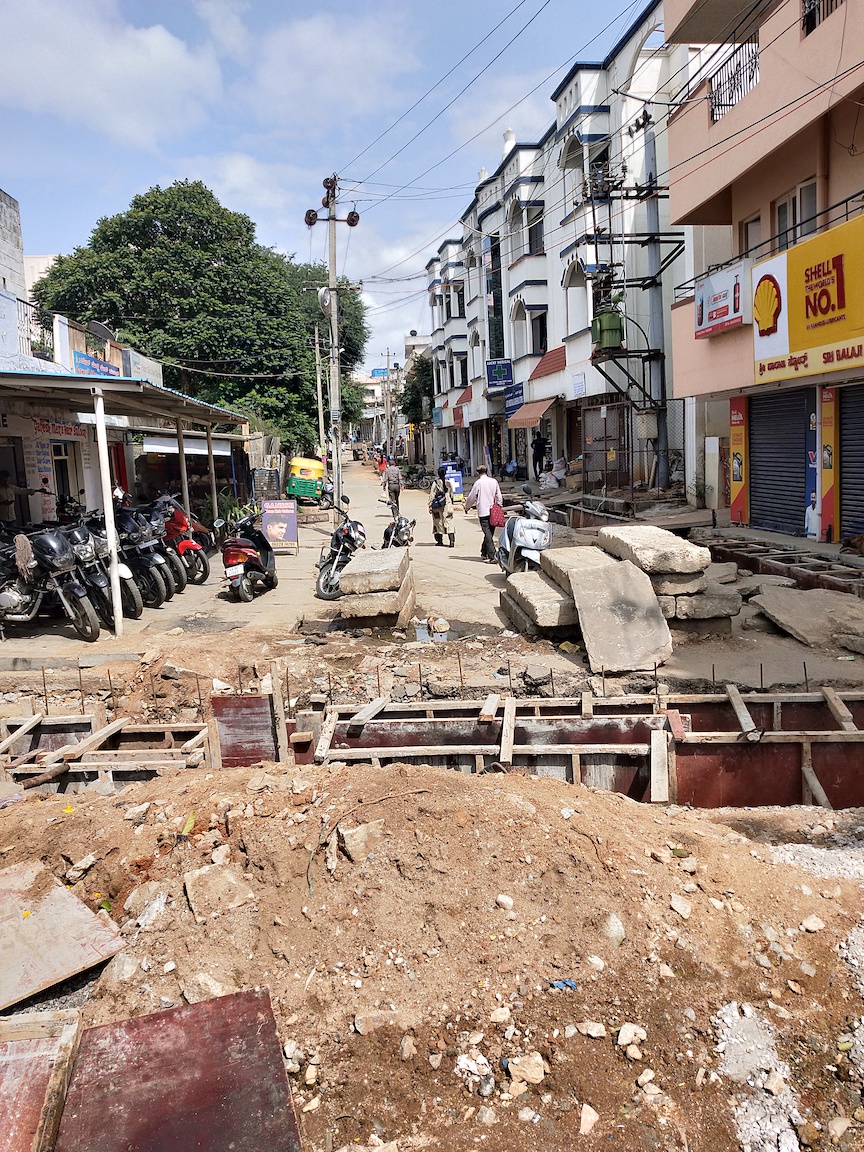
All that to say that many times, things are out of our control in the field. Next,
Working in R allows us to control all aspects of data analysis
I will talk about some of our favourite R packages and functions and what we use them for
Data Cleaning


We use all tidyverse packages for data cleaning. Ggplot for highly flexible plotting, purrr and map functions for more efficient and faster code instead of for loops, and forcats for functions. Readr, read_csv automatically parses date-time objects, that is is very helpful
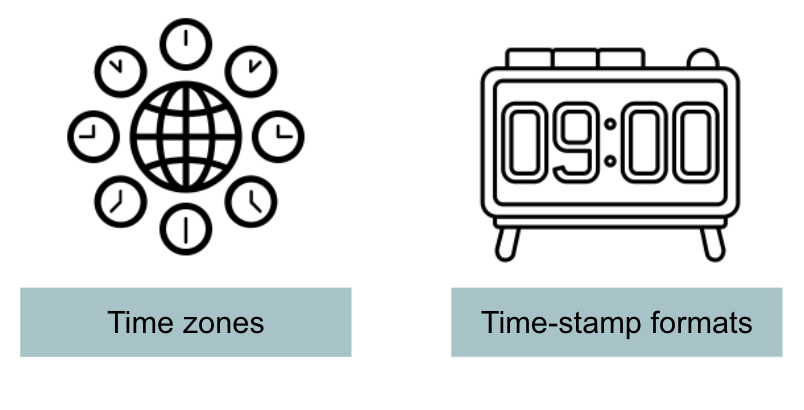
Consistent timestamps with lubridate

Data from different instruments often have different...
- Parsing date-times with
ymd_hms(),dmy_hms()... - Assigning time zone with
with_tz()
Step 1 is consistent time stamps so that we can join all data sets together. Some instruments are either in UTC time zone, or depending on the country of origin in a diff time zone.
Consitent column names with janitor
## [1] "Elevation" "Year" ## [3] "Month" "Day" ## [5] "Season" "Julian Day" ## [7] "PM2.5-11hrs" "PM2.5 -14hrs" ## [9] "PM2.5 -dailymean" "PM2.5-10-14 hrs mean" ## [11] "AOD-Terra" "AOD-Aqua" ## [13] "AOD-Terra-Aqua mean" "NDVI" ## [15] "CWV-Terra" "CWV-Aqua" ## [17] "CWV-Terra-Aqua mean" "2m Temperatue-11hrs" ## [19] "2m Temperature -14hrs" "2m Temperature-dailymean" ## [21] "2m Temperature-10-14 hrs mean"library(janitor)my_data <- my_data %>% clean_names()names(my_data)## [1] "elevation" "year" ## [3] "month" "day" ## [5] "season" "julian_day" ## [7] "pm2_5_11hrs" "pm2_5_14hrs" ## [9] "pm2_5_dailymean" "pm2_5_10_14_hrs_mean" ## [11] "aod_terra" "aod_aqua" ## [13] "aod_terra_aqua_mean" "ndvi" ## [15] "cwv_terra" "cwv_aqua" ## [17] "cwv_terra_aqua_mean" "x2m_temperatue_11hrs" ## [19] "x2m_temperature_14hrs" "x2m_temperature_dailymean" ## [21] "x2m_temperature_10_14_hrs_mean"There are several inconsistent features here. Use of dash vs space, colum names starting with numbers, capital letters vs small letters.
Interactive maps with leaflet
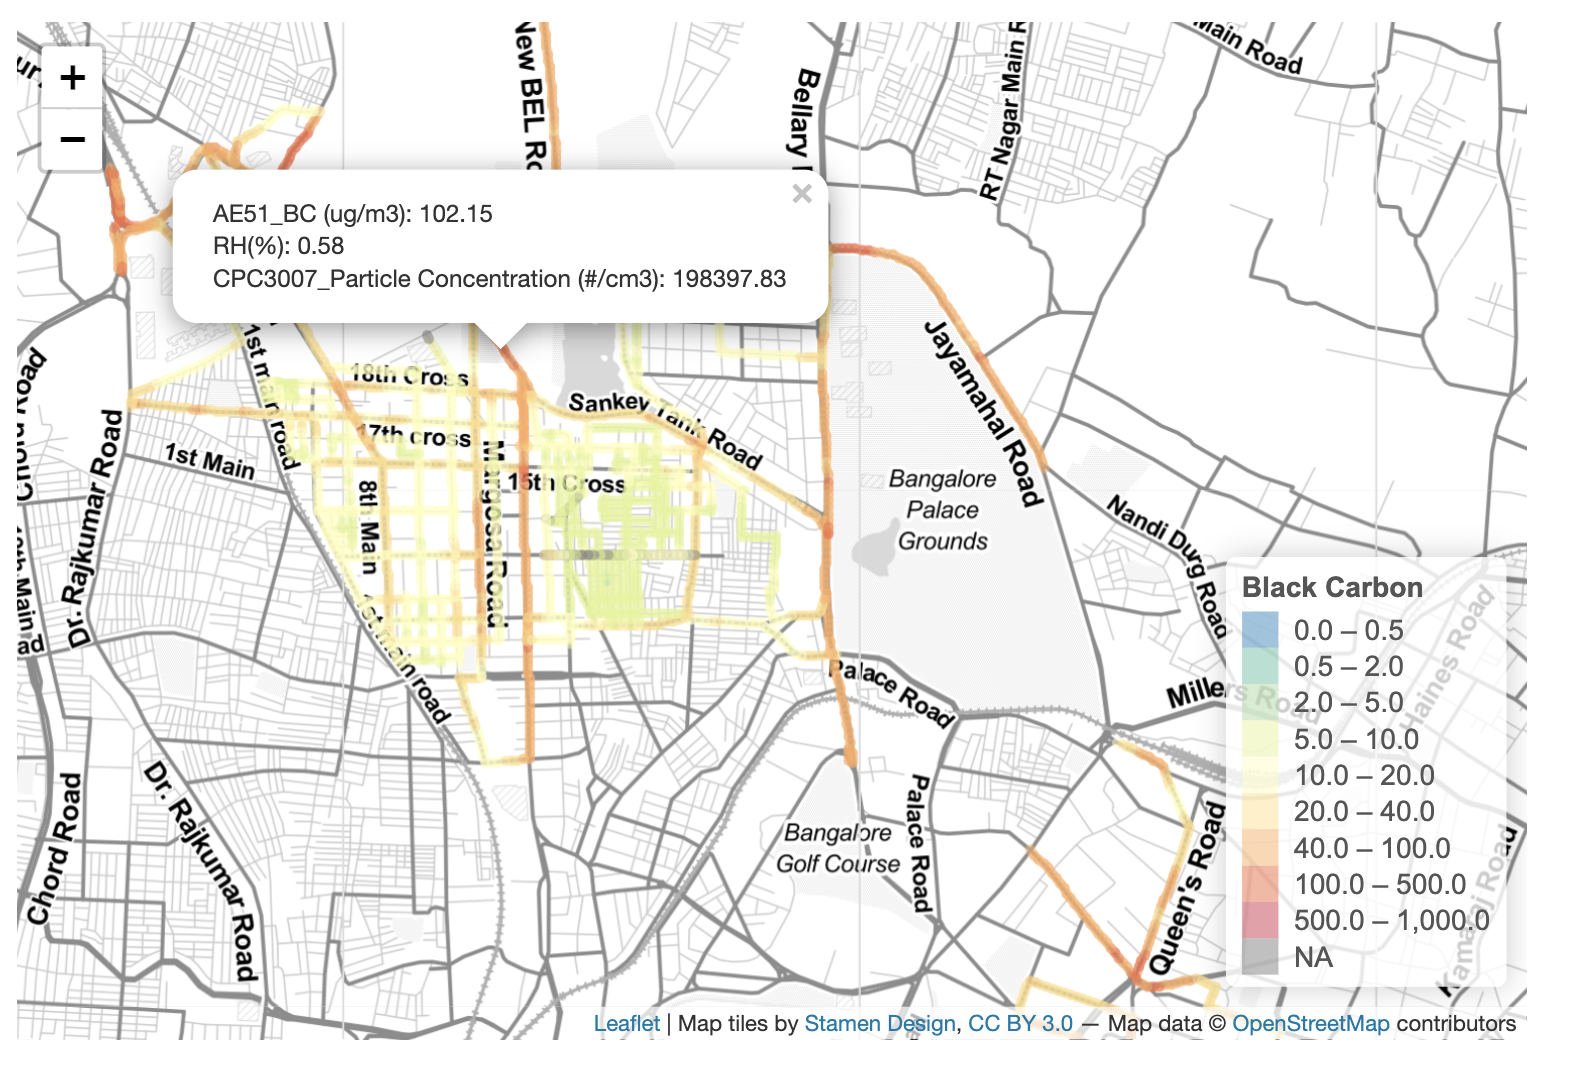
demo we are looking at averages over several rides, so these are stable maps. You may recall the purpose of mobile monitoring is high resolution pollution maps combining location and pollution data
Statistical Modelling
Base R
- linear, multilinear
lm() - logit
glm() - pca
prcomp()
- linear, multilinear
lme4package- Linear mixed effect models
gampackage- General additive models ]
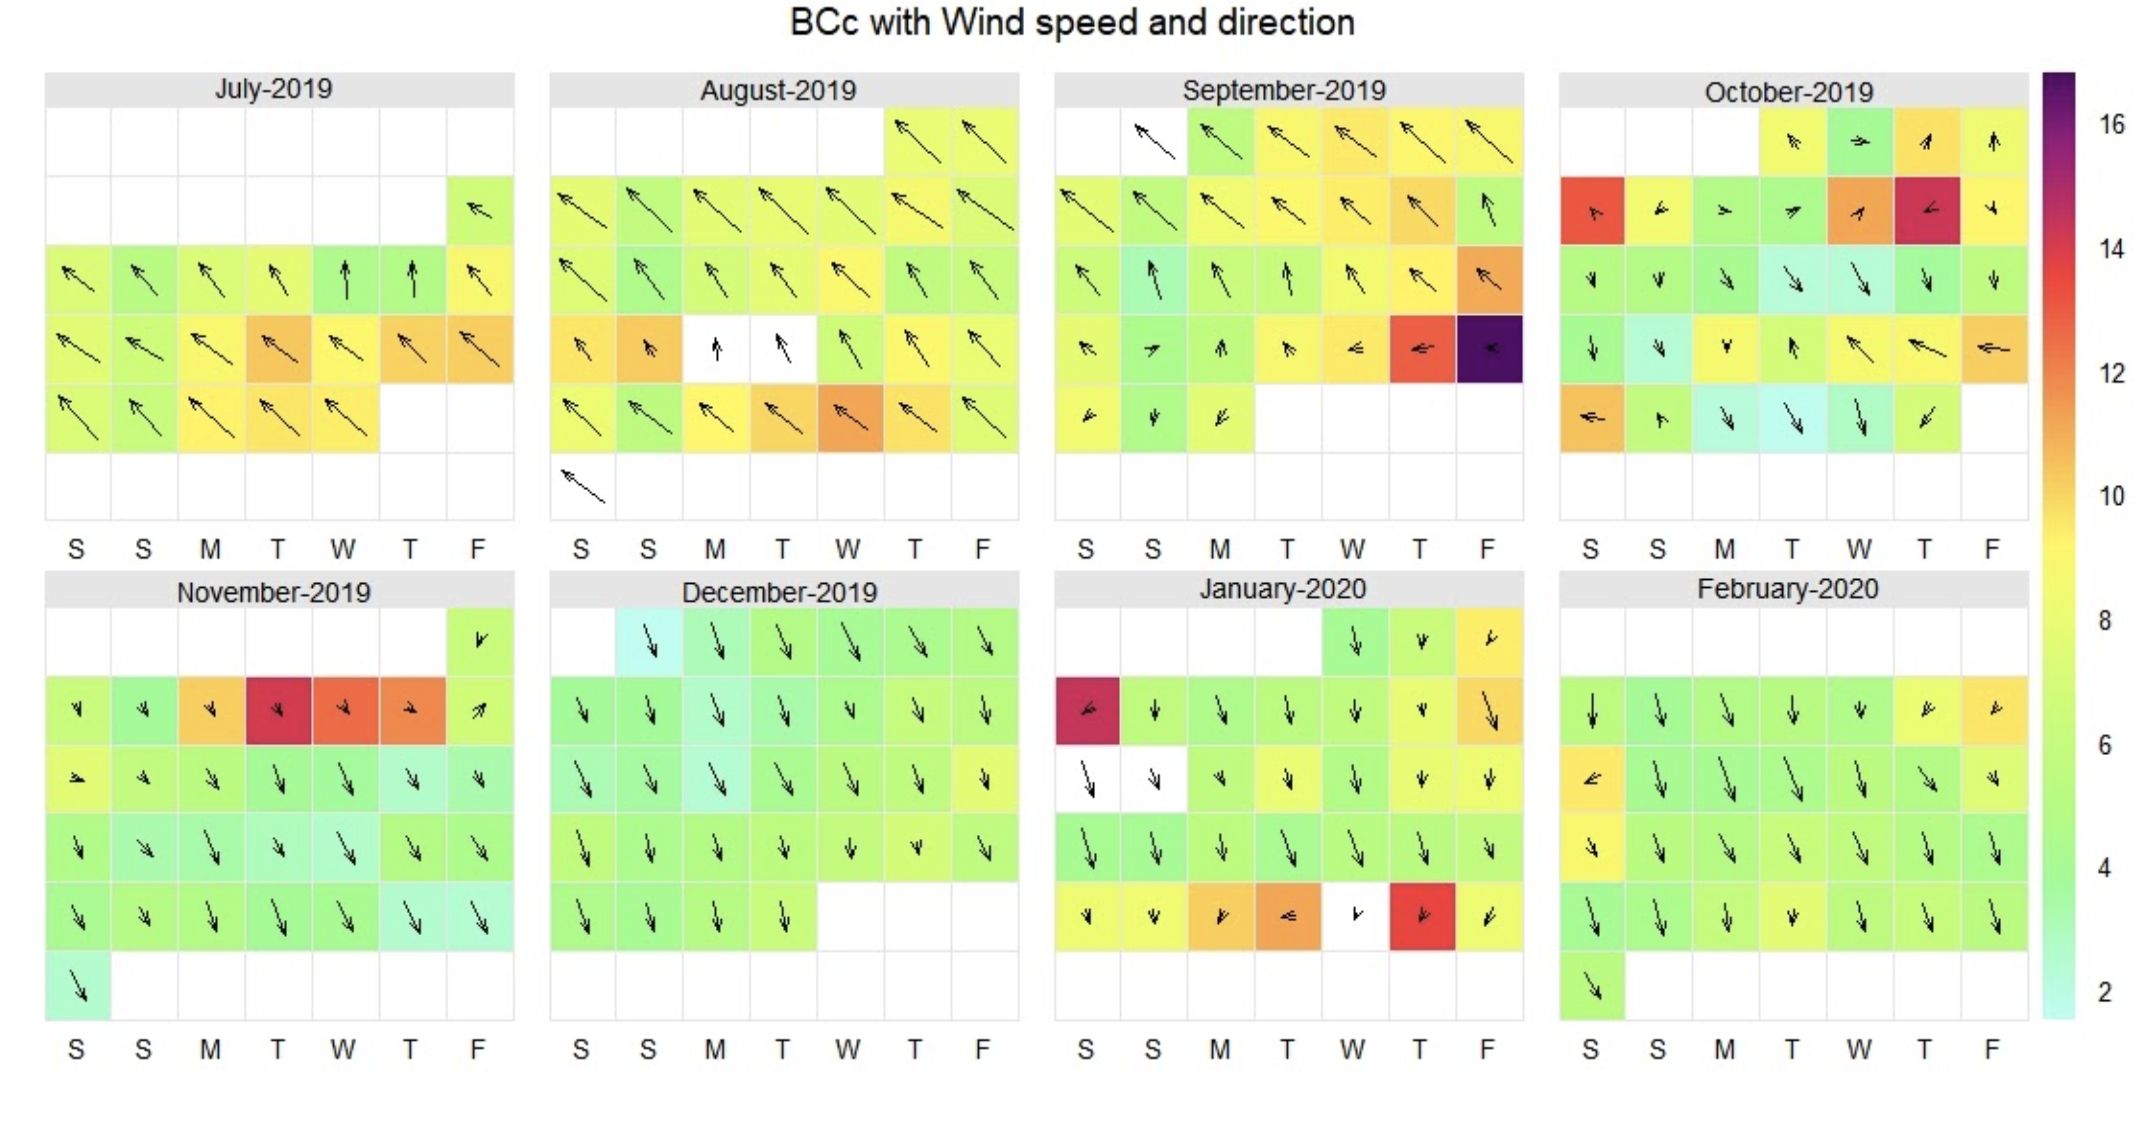
cool plot options.
Using shiny apps
To simplify repeat data analysis tasks
There are plenty of repeat tasks. Mapping each neighborhood 20+ times and then mapping several neighborhoods
https://github.com/meenakshi-kushwaha/mmaqshiny
Mobile monitoring
Data from multiple monitors
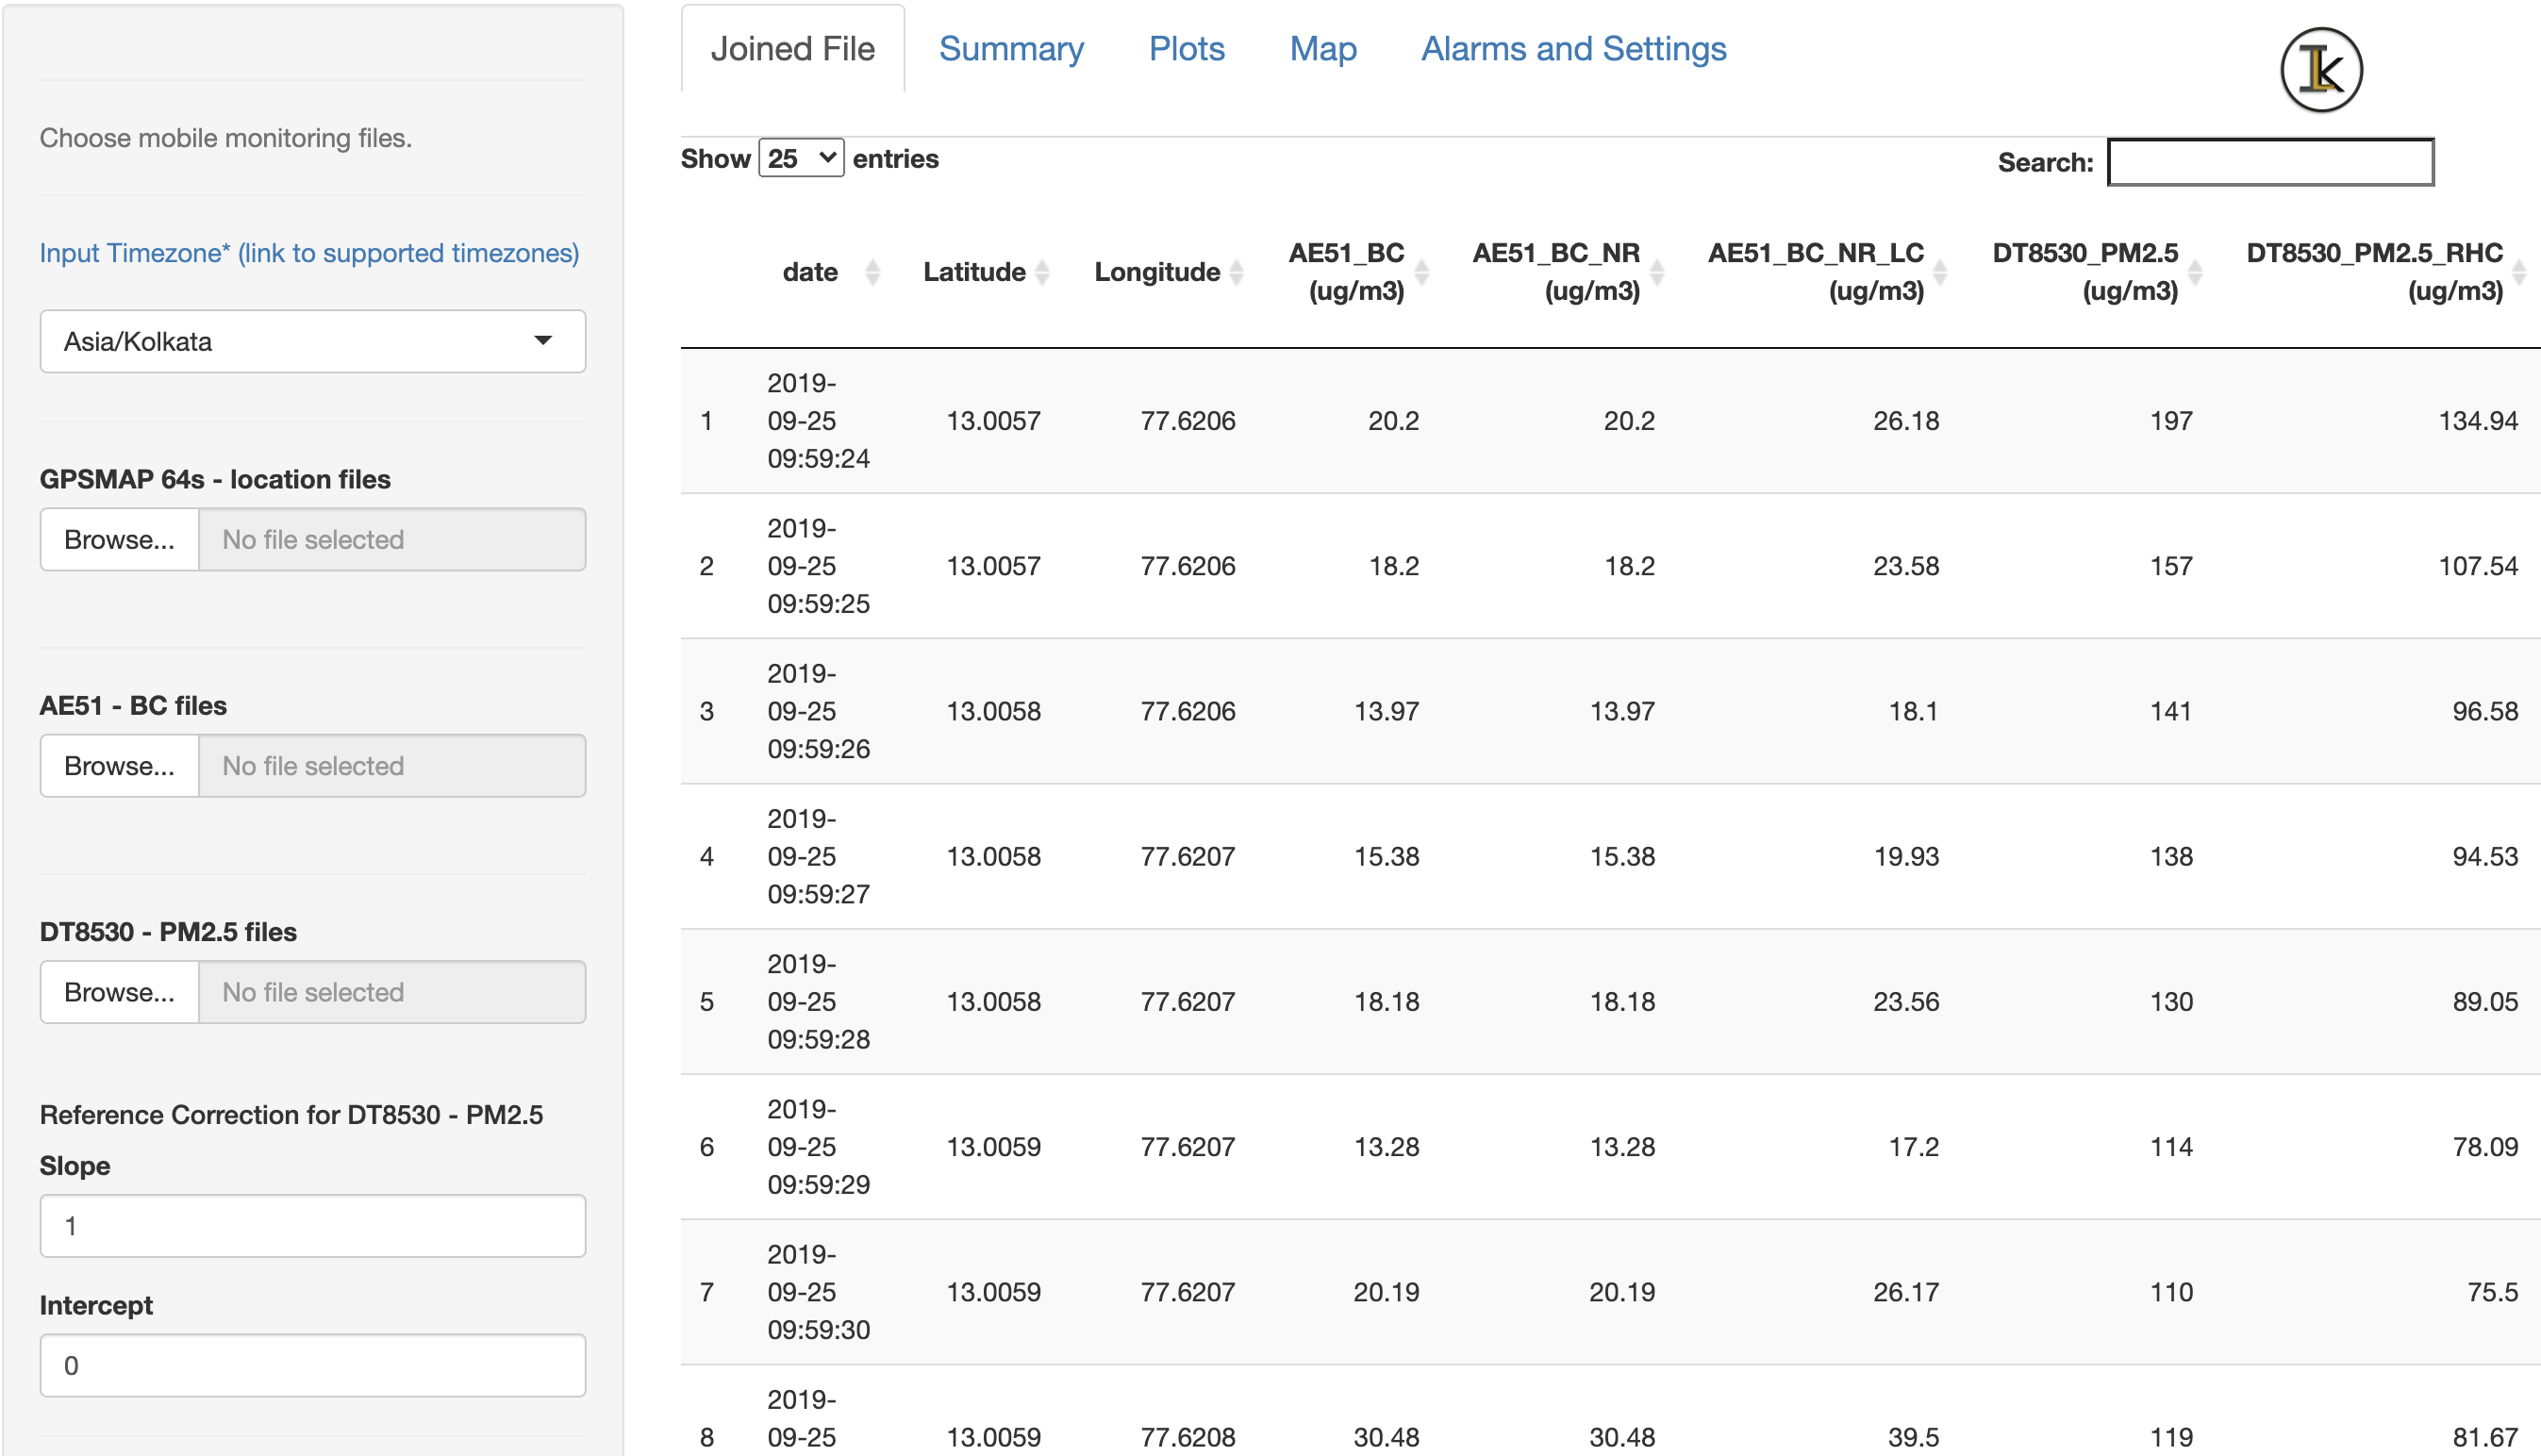
Option to upload each file and automatically joins them. There are alarm and settings so we know if something is wrong. and time series plots for daily qa/qc
https://github.com/adithirgis/pollucheck
Staionary data
Cleaning and analysing open source data
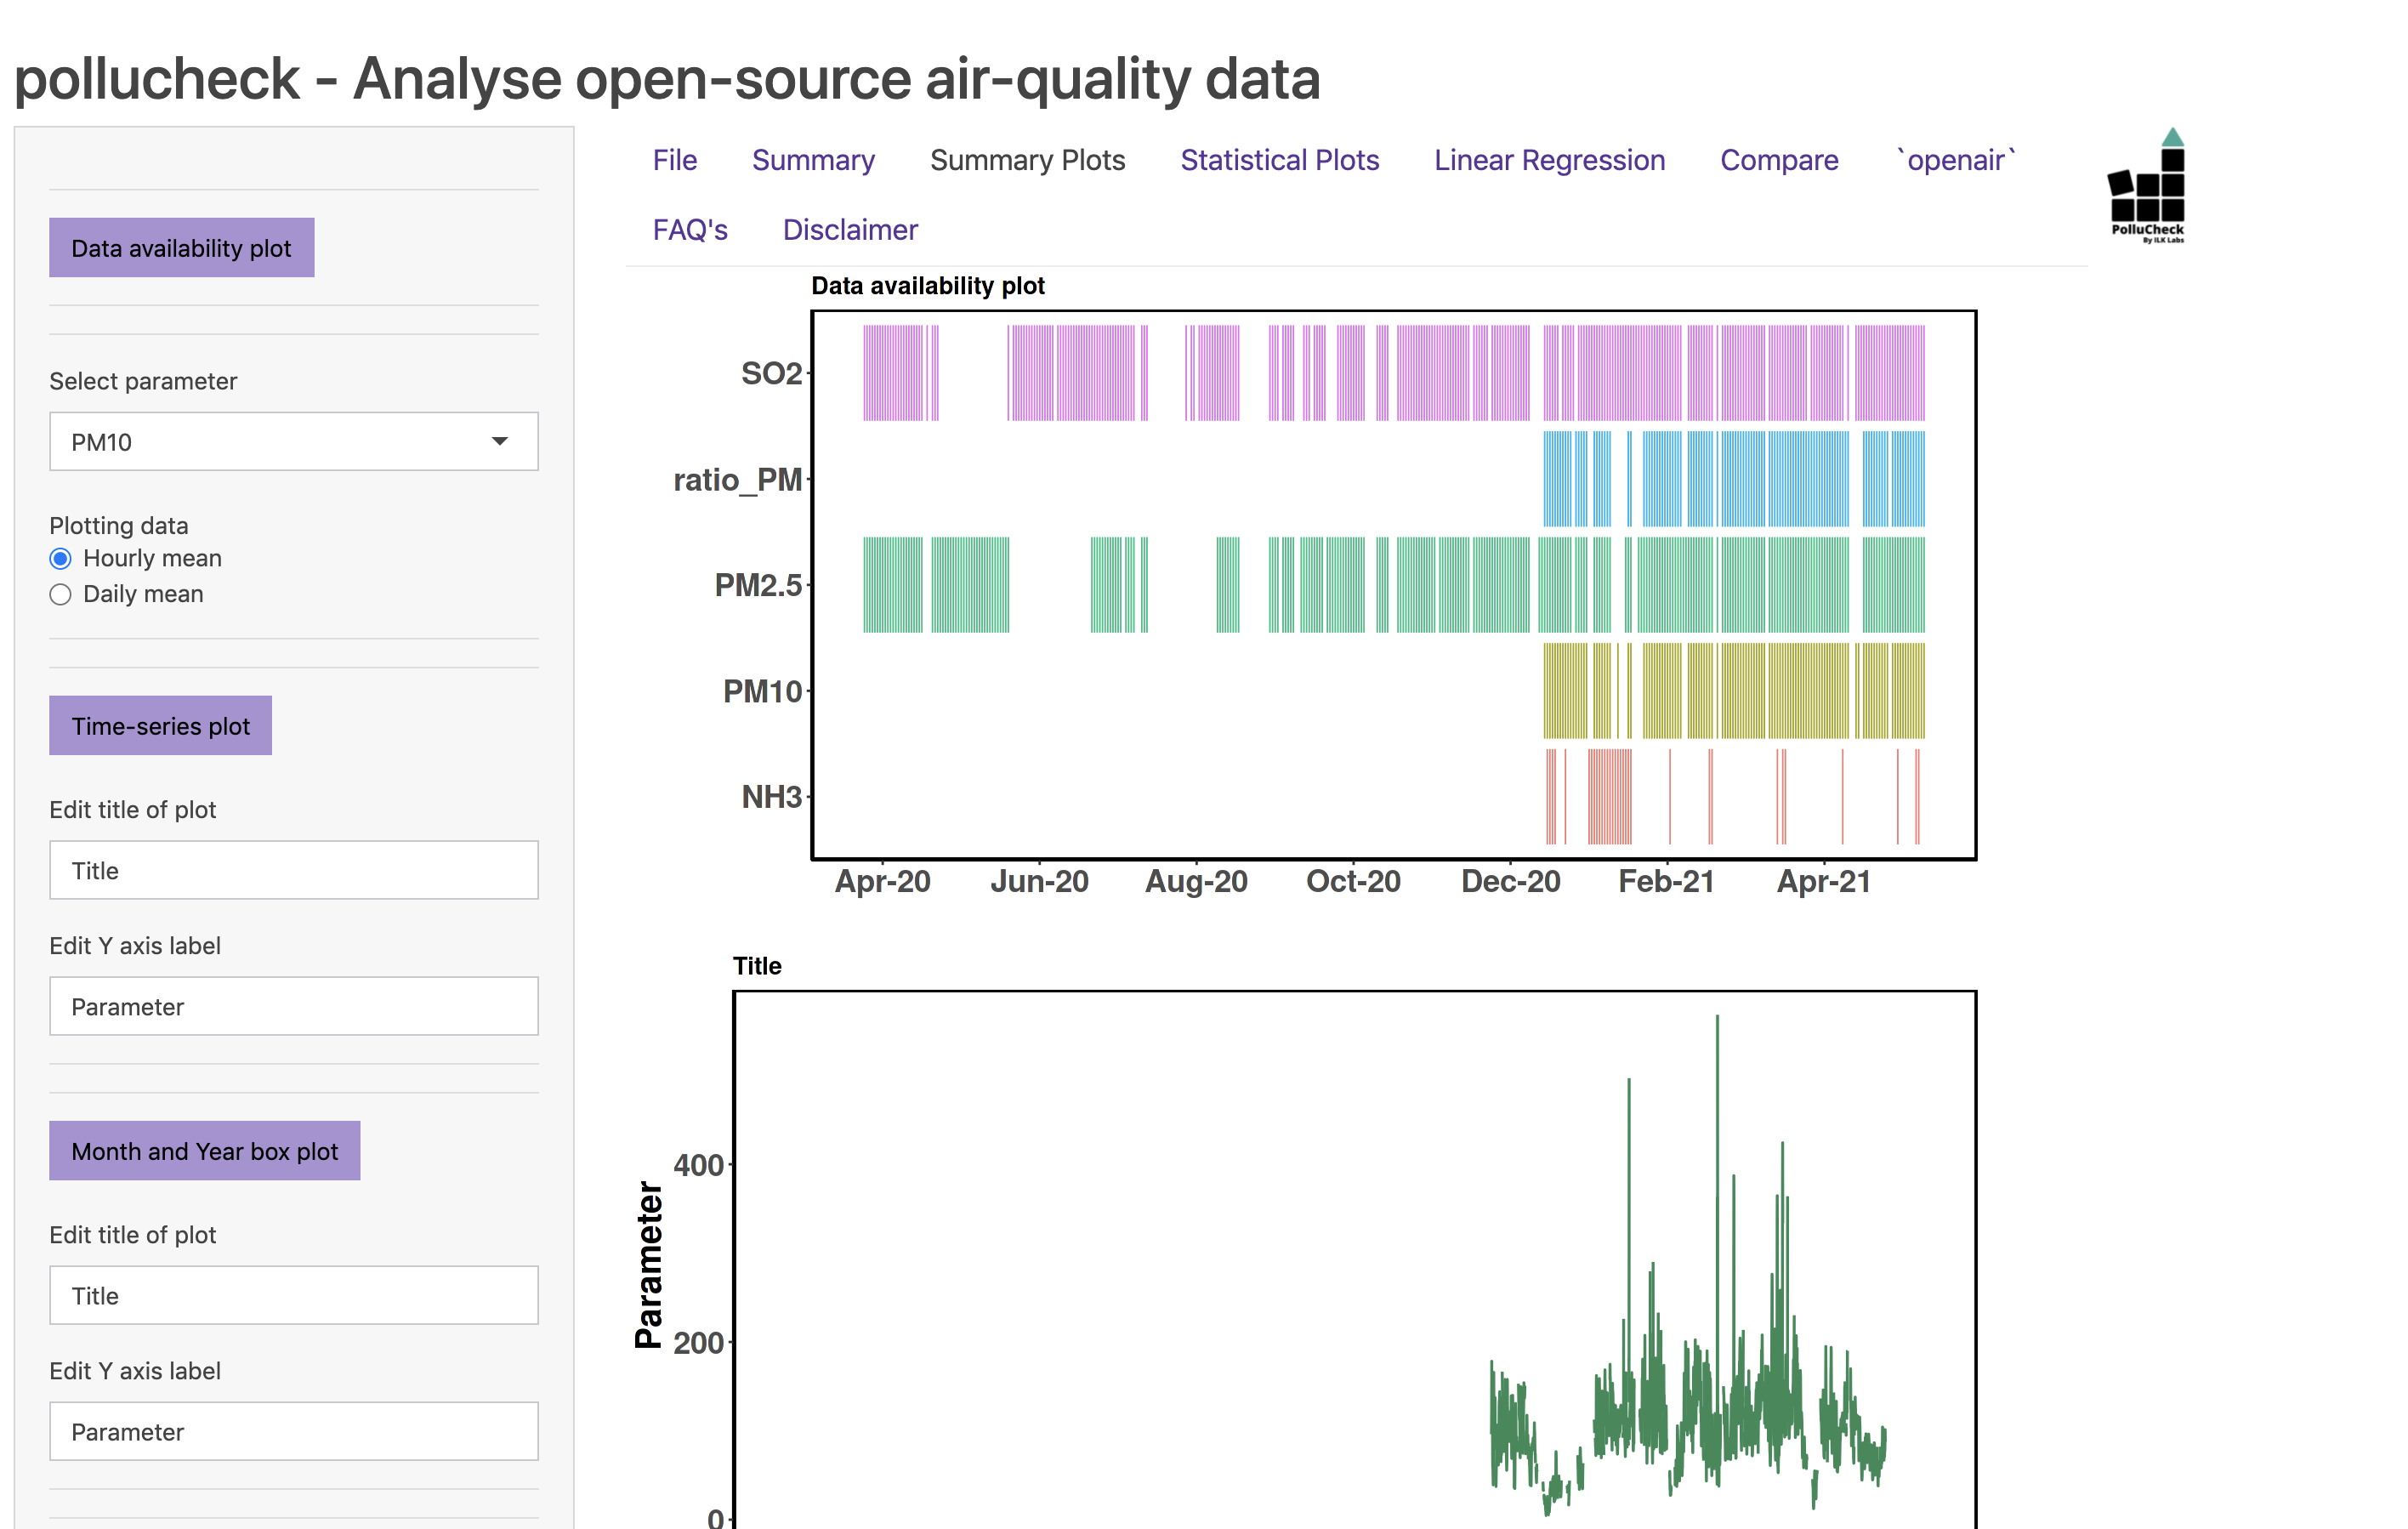
another shiny app that we have developed aims to simplify cleaning data from open access data from stationary monitors and automatically generate statistical plots.
Elevator Pitch
6th July
6:30 to 8:00 pm IST
Pitch no - 26
Beyond data analysis
Organizing and sharing using R
R projects
+
version control
+
README
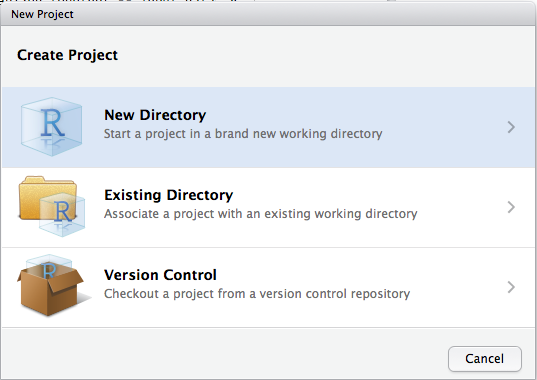
- Create an R studio project for each new project
- Use github for version control
- Initiate with a README file that contains
- Project description
- File name descriptions
- Other metadata
project description could be collection dates, locations, etc.
Reporting with R Markdown
Code and outputs side by side
Facilitates sharing and reviewing
Repdroduce analysis easily
Different output formats possible
a <- 2I have `r a` cats and `r a+1` dogs.I have 2 cats and 3 dogs.
---title: "TOC"output: html_document: toc: true toc_float: true---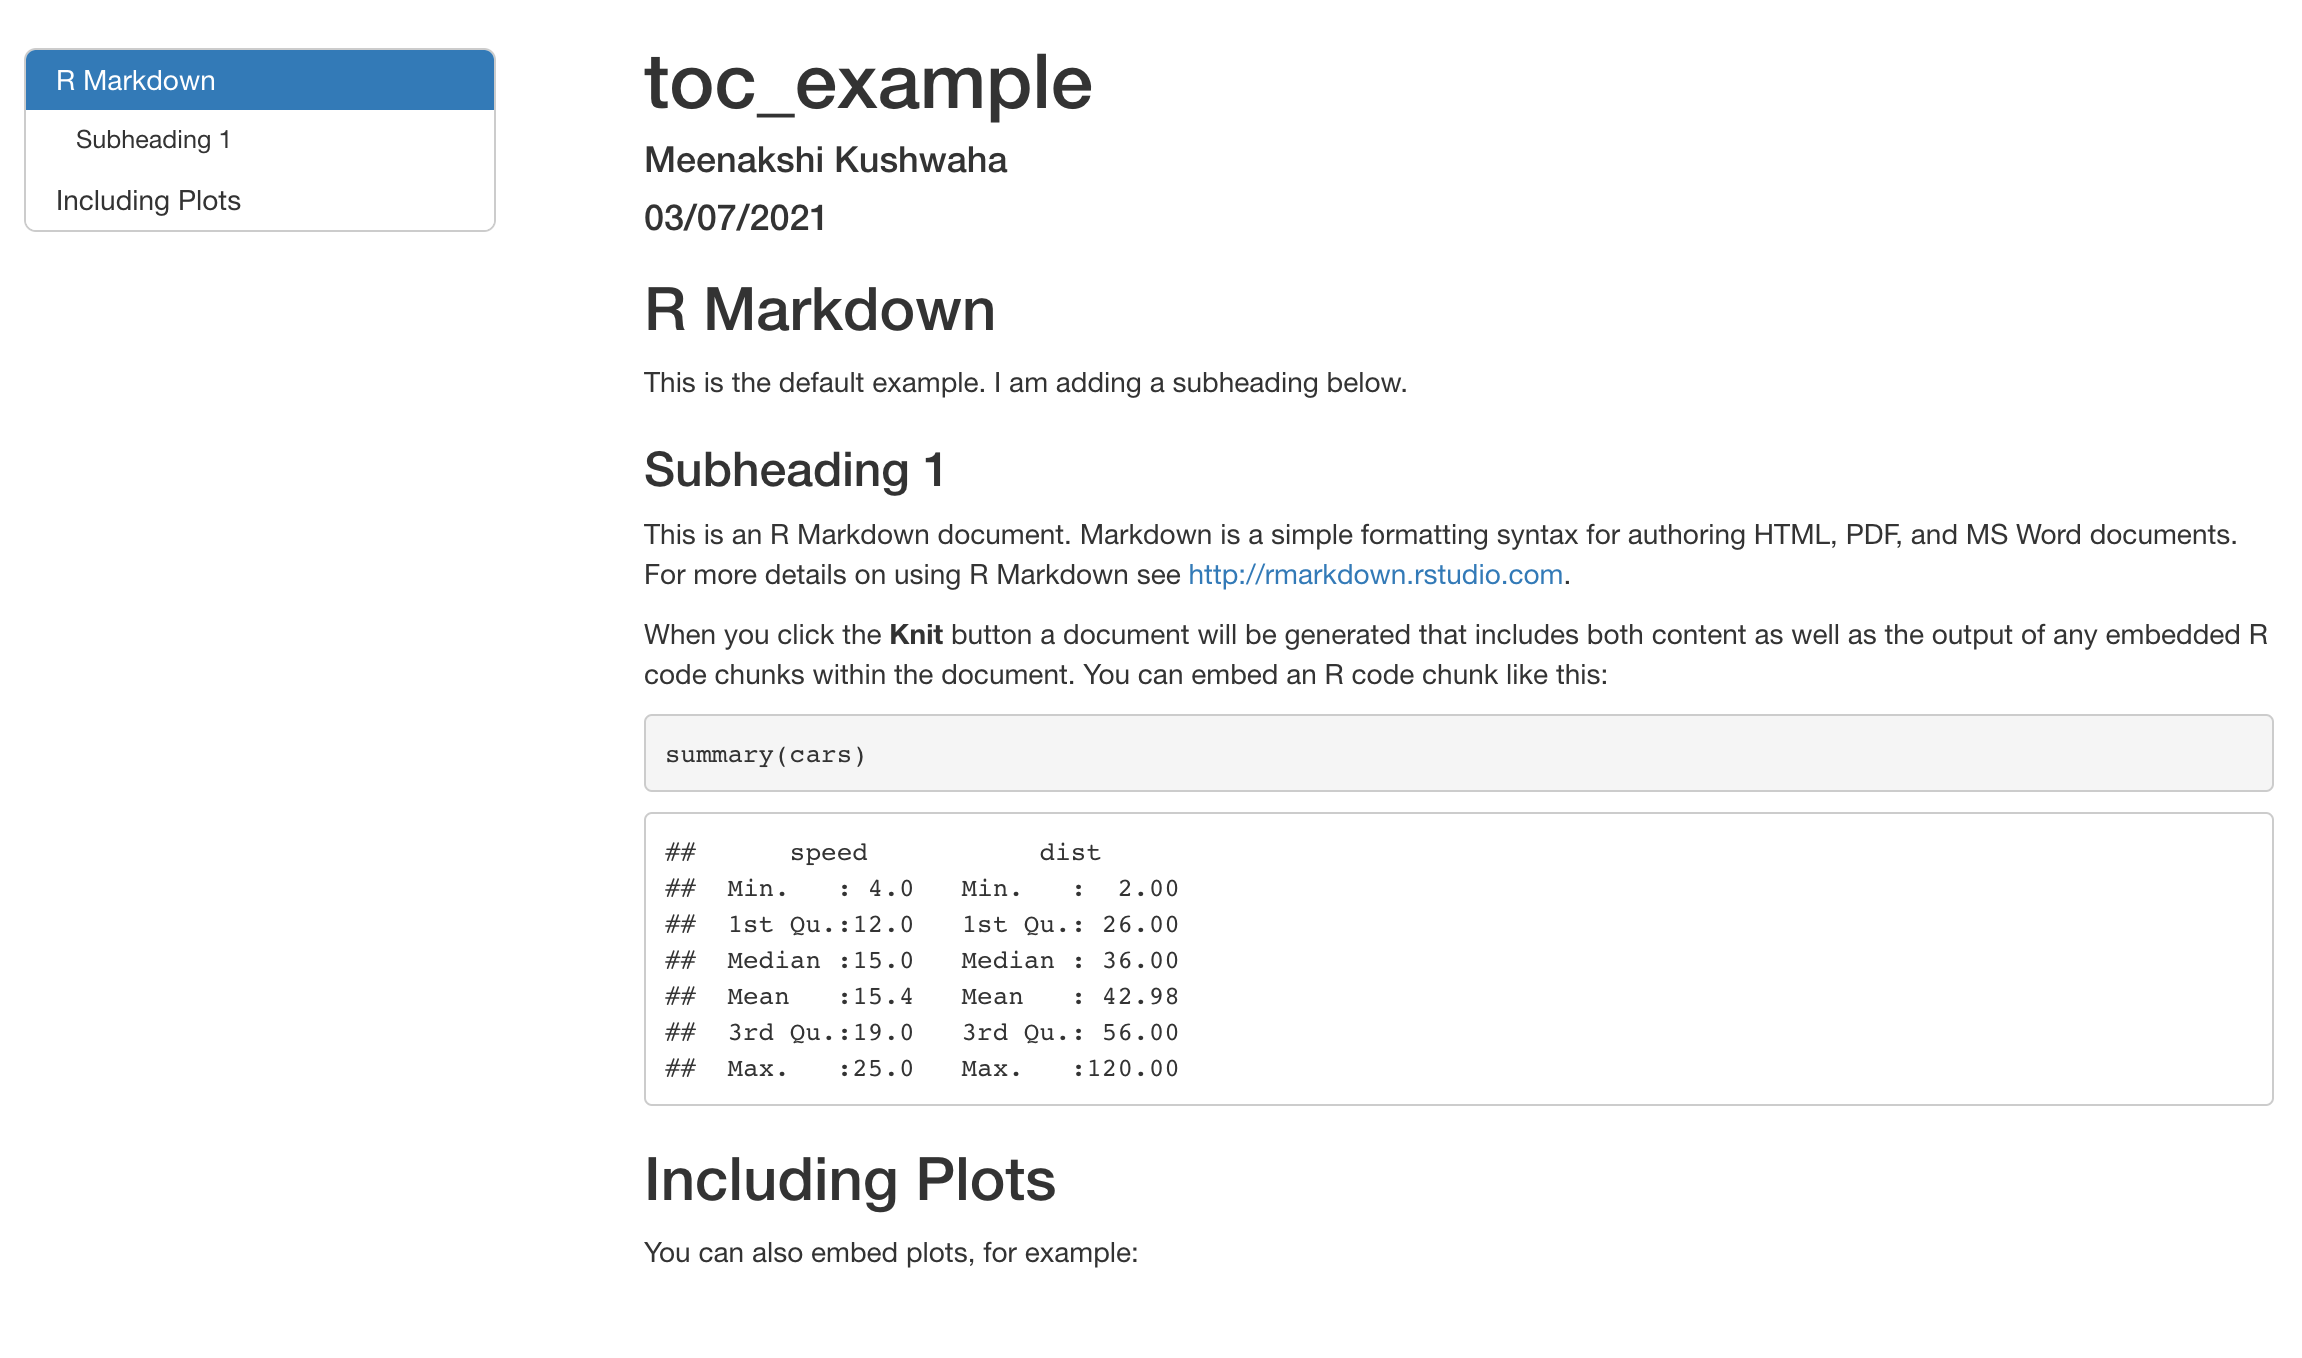
Individual diagnostic reports using parameters
---title: "Diagnostic Report" output: html_documentparams: year: 2021 region: Site_1 data: file.csv---
What we have learnt from the R community
We did not set out to learn these lessons
But we are so glad we did!
Lesson 1
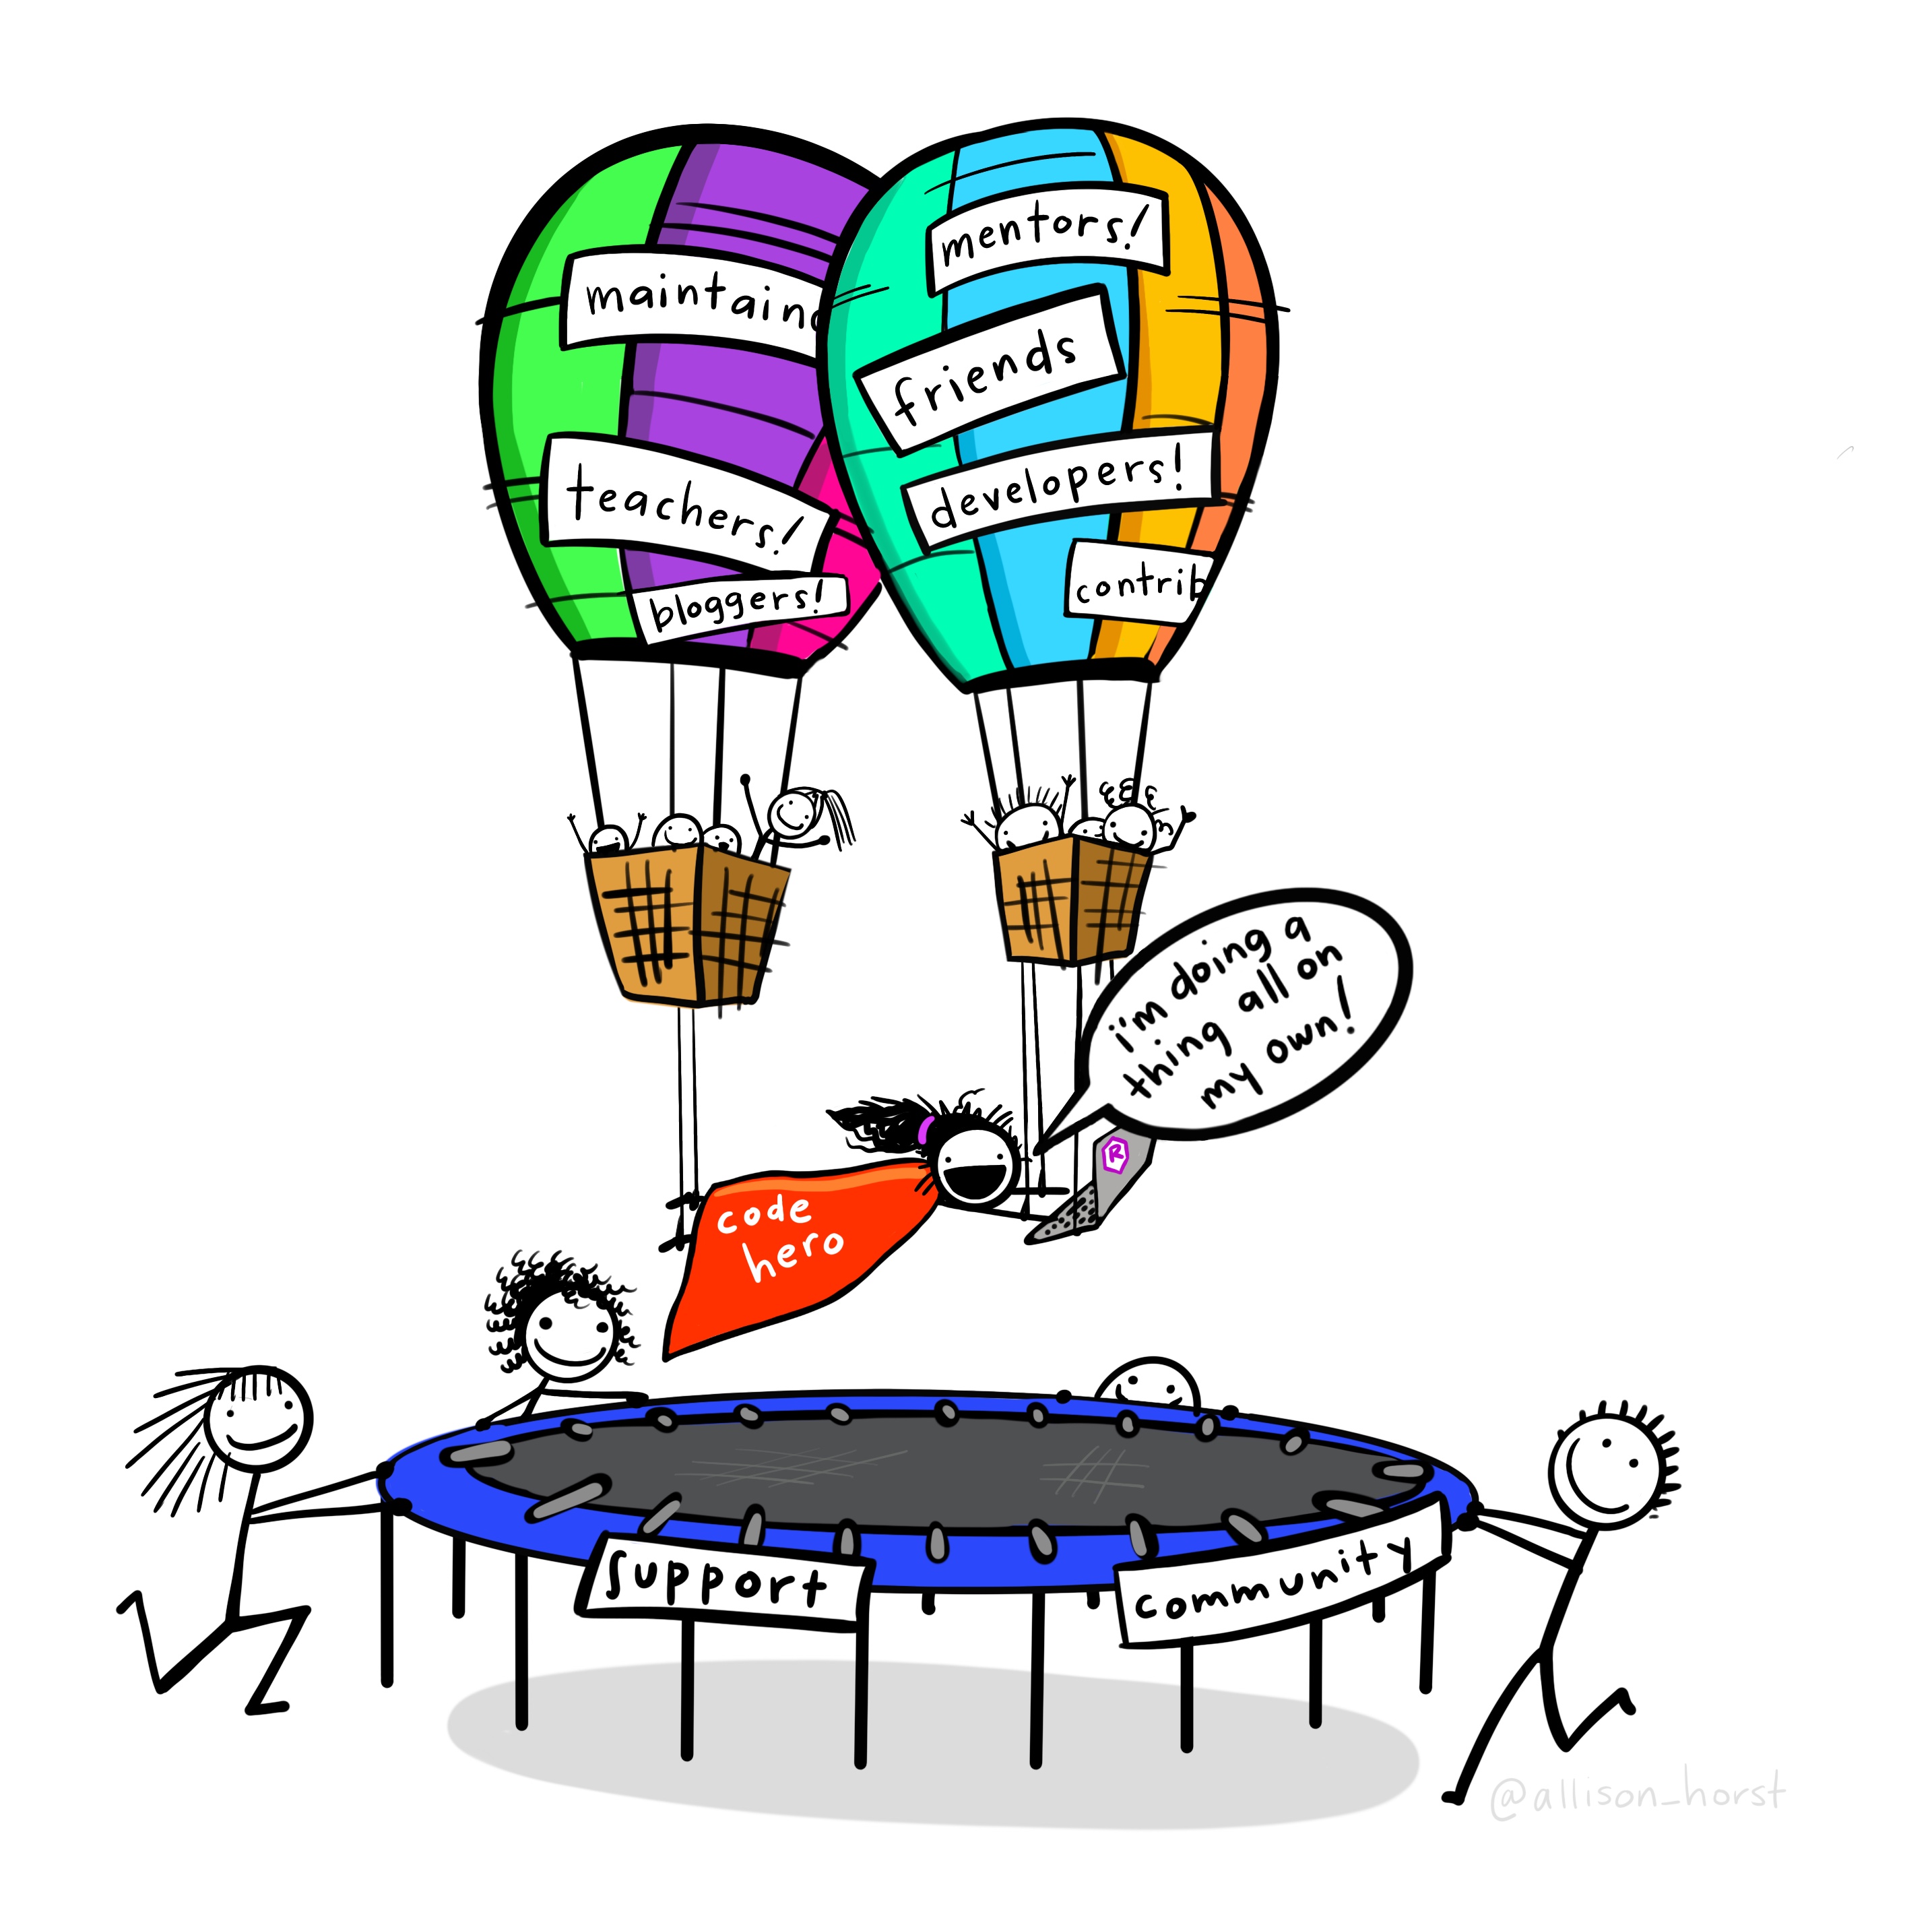
Importance of Community
![]()
If someone had said, join R because of amazing community, i would never have believed it. I just needed technology to learn to make cool plots.
Slack channels
Book clubs
Meet ups


Lesson 2
Using artwork for teaching
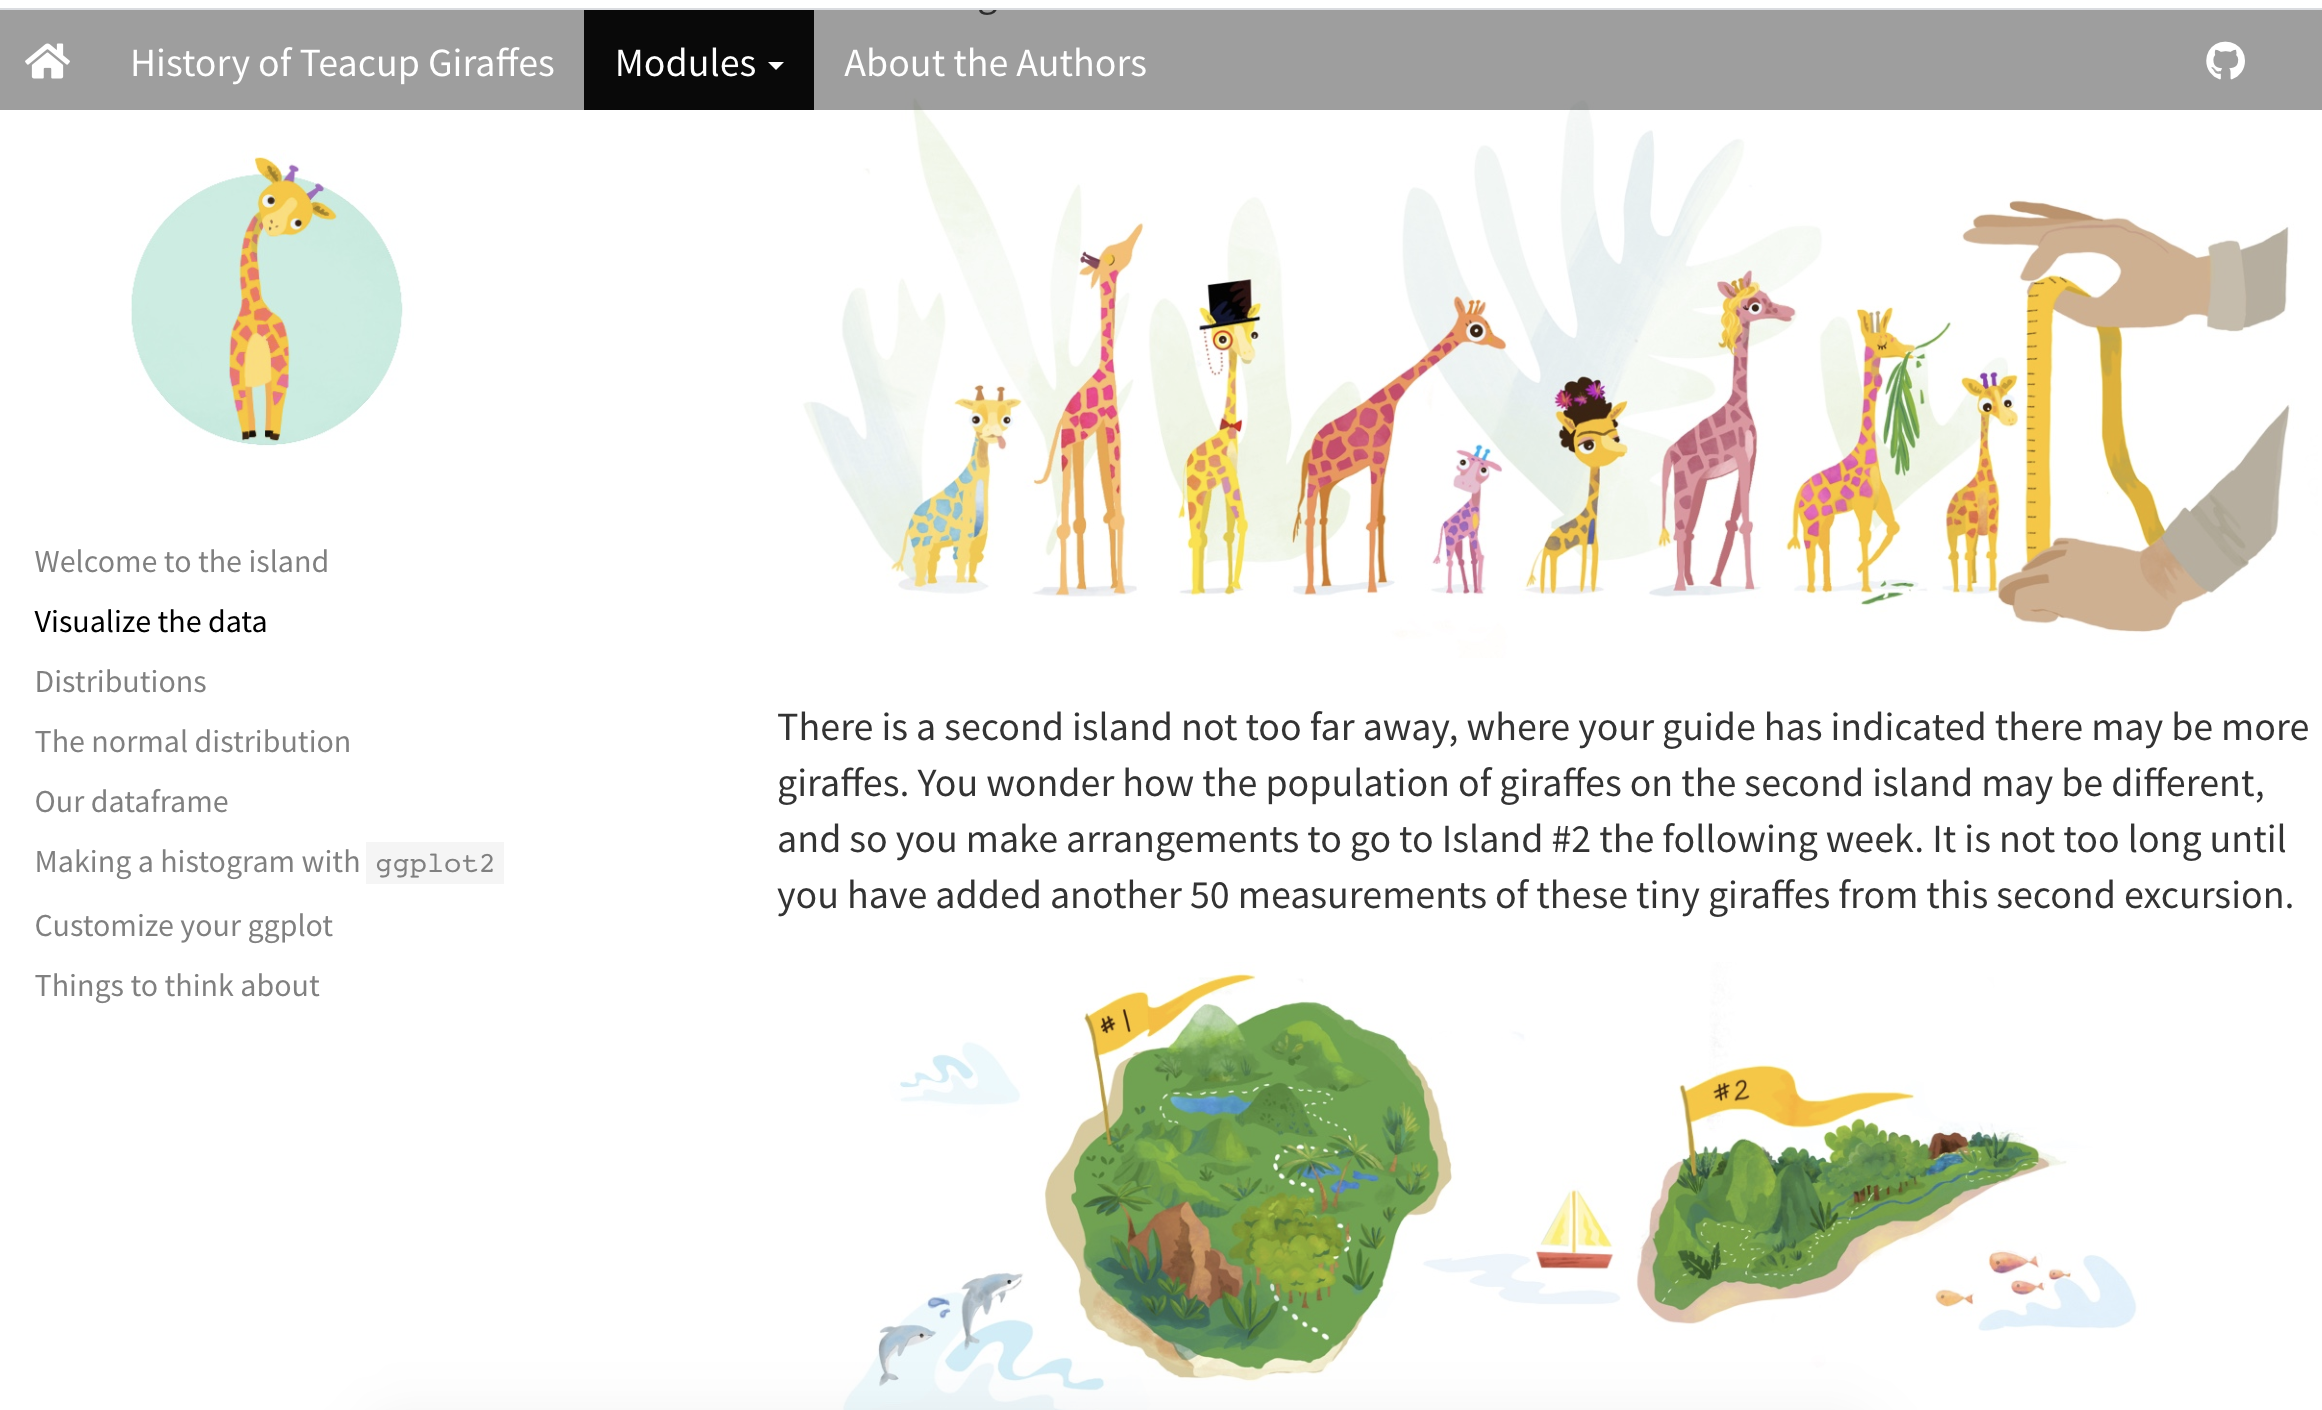
https://tinystats.github.io/teacups-giraffes-and-statistics/index.html
Teacup Giraffes
By Walum & Leon
"A delightful series of modules to learn statistics and R coding for students, scientists, and stats-enthusiasts"
Lesson 3
Open source and collaboration
Coding practices for easier collaboration
Using projects and version control for organizing
- Descriptive README files
Following tidyverse style guide for code
- Consistent naming for functions and objects
Commenting for "why" of code and new packages
Using relative file paths and avoid hard-coding file locations
- Use package
hereinstead ofsetwd()
- Use package

What next?
Bookdown project
- Organizing field protocols and code
Tidymodels
Accessibility
Now that we have the lu
Research Partners


